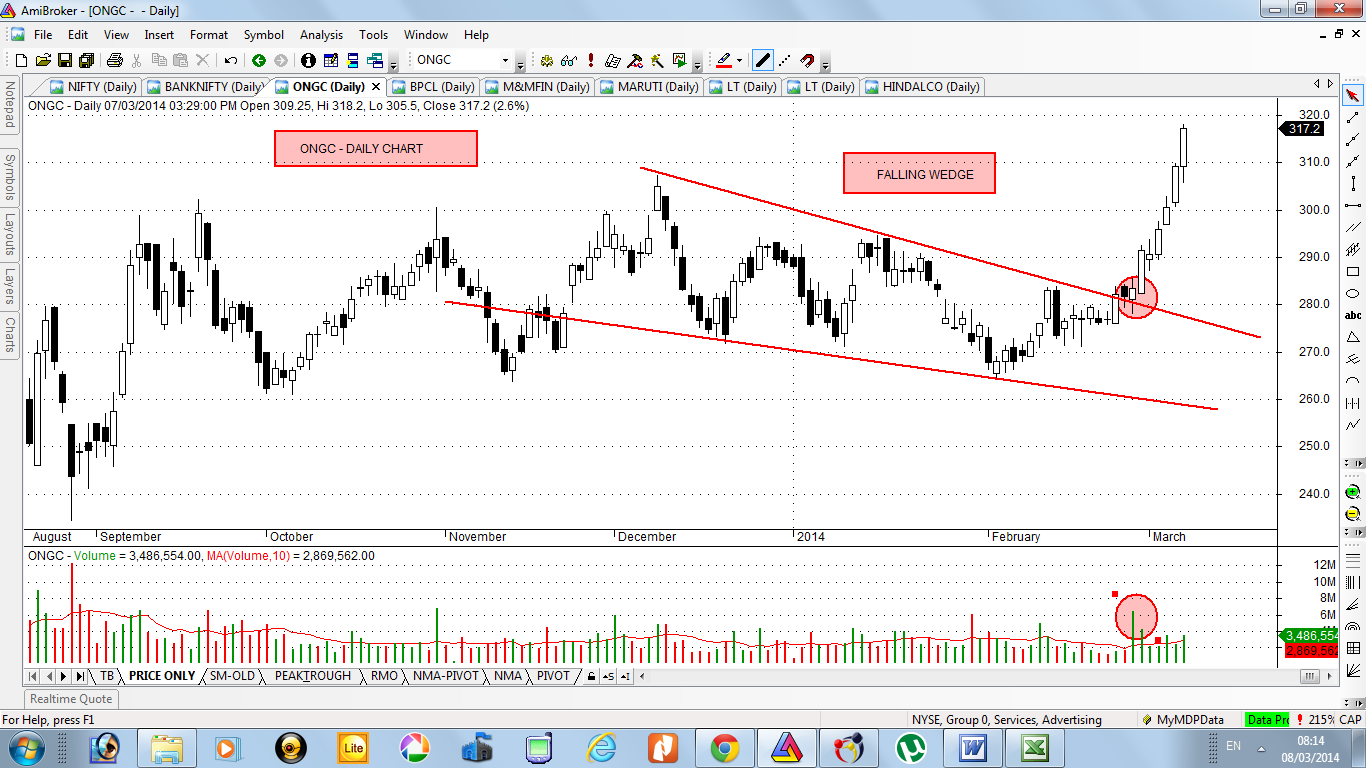
ONGC – DAILY CHART – FALLING WEDGE
This is also a good example of FALLING WEDGE on ONGC. We can see once it breaks the upper line with volume it shoots up sharply. It gave a very good return after breaking the wedge. From 280 to 320 within 7 trading sessions. Currently, it has also break the resistance of 305-310 and if it holds this level on closing basis then we can see further significant upside in stock.
