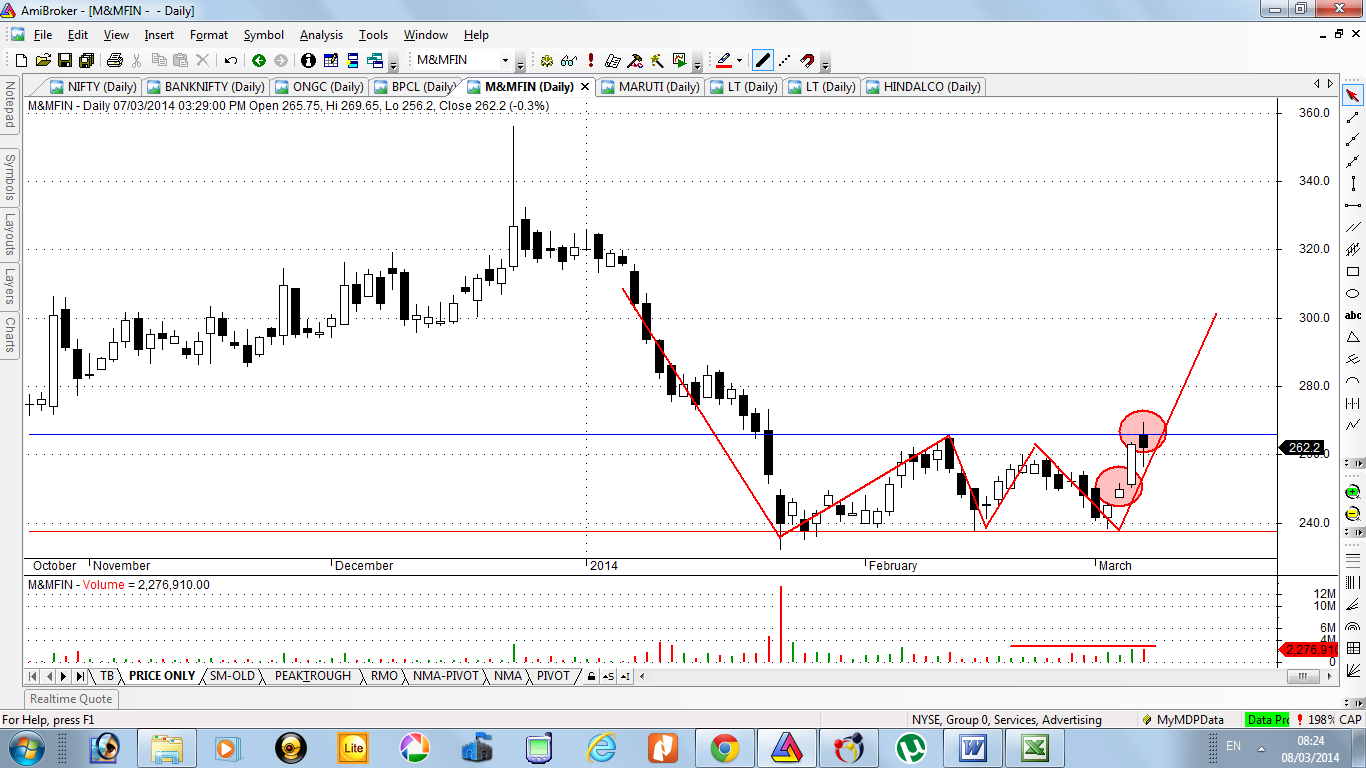
This chart is updating here only to watch it for next few days. It is trading at short term resistance level. It is trying to clear it but VOLUME IS NOT SUPPORTING. Once it break the resistance level significantly with volume then ready to take position for appreciation of 20-30 rupees from here. Otherwise it may be a fakeout.
Currently it is trading in range from Jan’14 level
