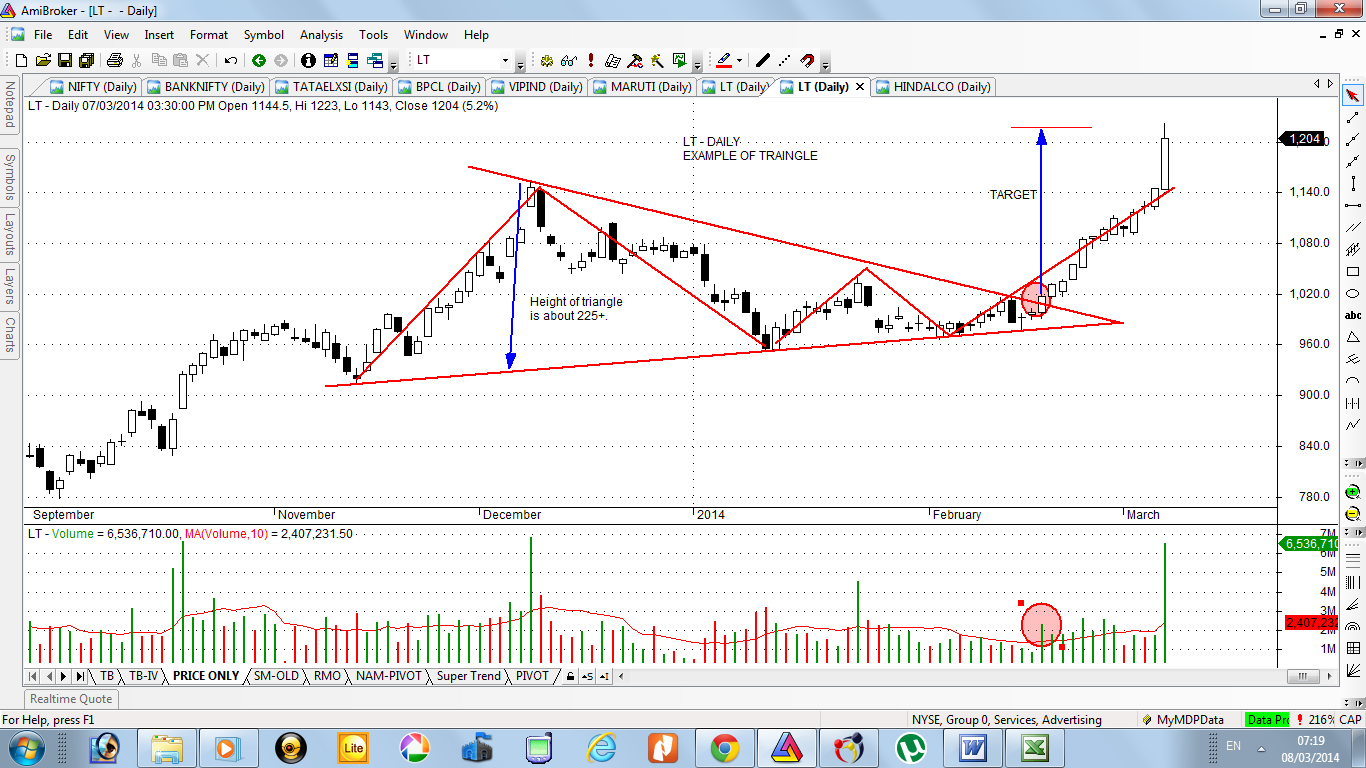
L&T – DAILY – TRIANGLE BREAKOUT
A very beautiful example of triangle breakout in L&T. Just watch the height of triangle is about 225+ so here we can expect the same amount of target once it break the triangle and after breaking the triangle with volume it touched 1223 level after breaking the 1008 level. Almost same amount of target which is height of triangle i.e. more than 22% return within 13 days.
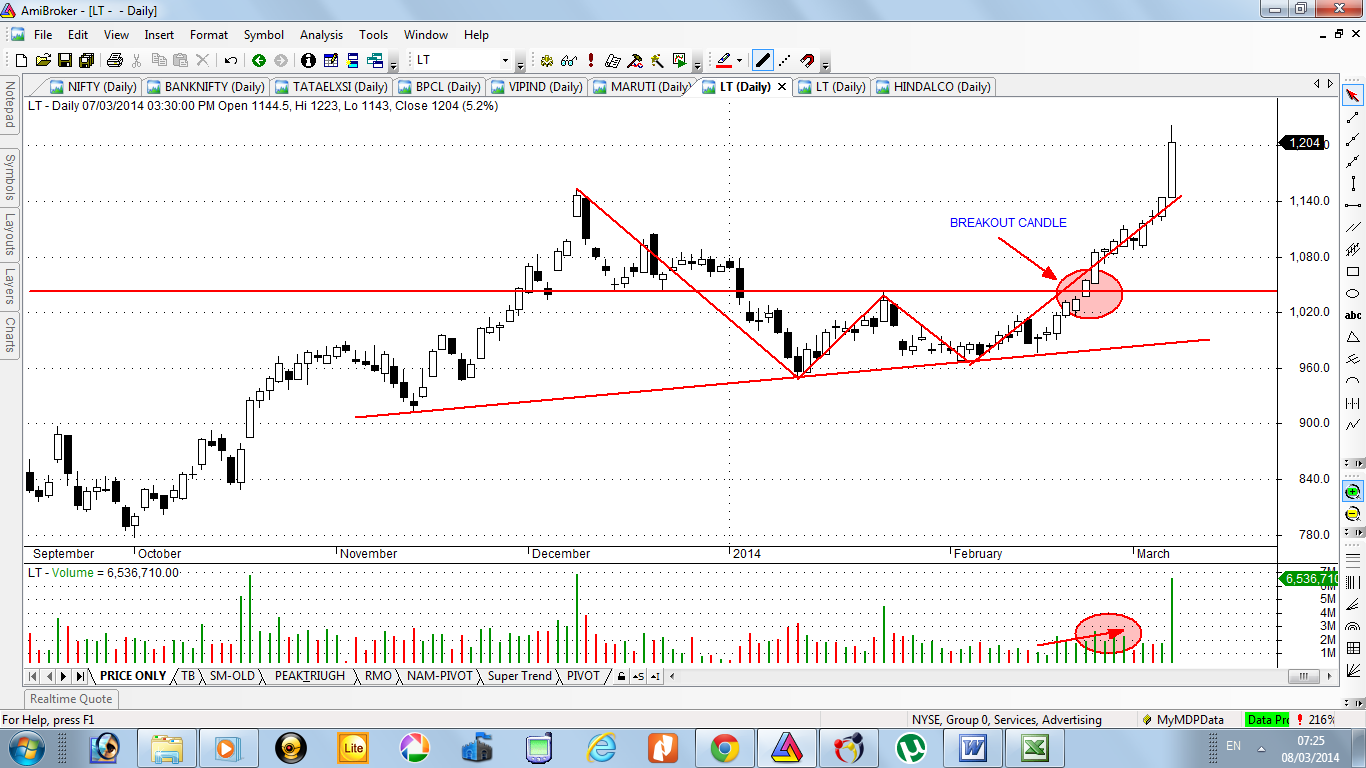
Also watch 2nd chart which is showing the breakout of double bottom. It shows we can interpret same charts in different angles & different ways. (Whichever is the way purpose is to catch the trend before it burst)

