HINDALCO IND. – DAILY
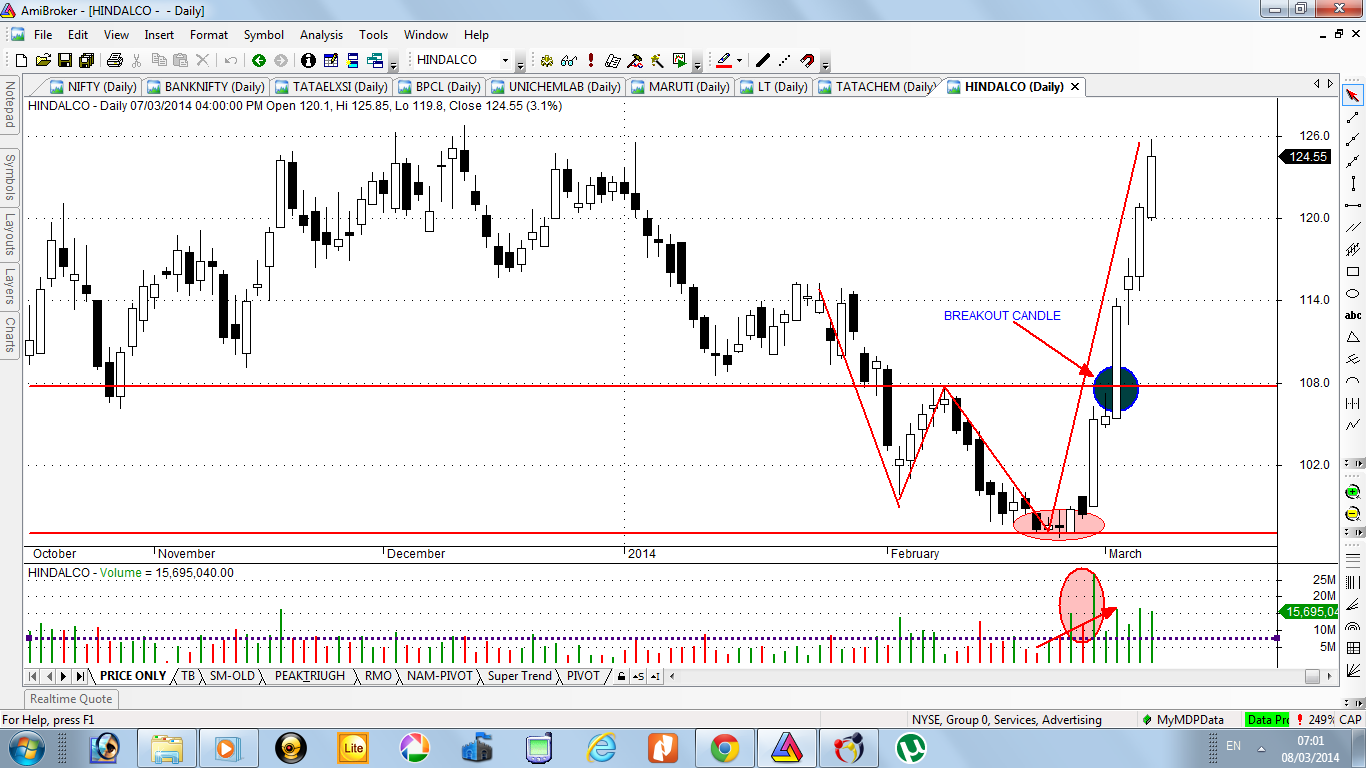
This chart is showing the example of double bottom, volume, accumulation & breakout. Good return in a very small span to time. Just see the accumulation around 95-97 level and also the volume is increasing day by day. Also see once it break the neckline around 110 it became rocket and now trading around 125 level. So, 100 to 125 within 6-7 trading session.
